Nuke’s main window is divided into three panes: the Node Graph/Curve Editor/Dope Sheet pane, the Properties/Script Editor pane, and the Viewer pane.
![]()
You can add panels onto these panes, for example:
• Toolbars for selecting nodes
• Node Graphs (also known as DAGs) for building node trees
• Curve Editors for editing animation curves
• Properties Bins for adjusting the nodes’ controls
• Viewers for previewing the output
• Progress panels for displaying progress bars
• Script Editors for executing Python commands.
By default, there is a Node Graph panel in the lower left corner, a Viewer panel in the top left corner, and a Properties panel on the right.
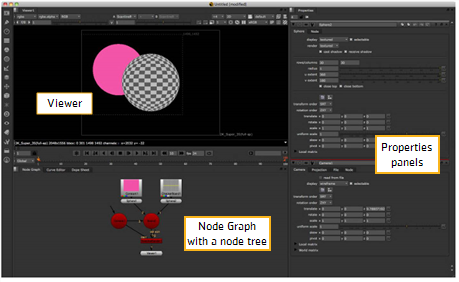
The Node Graph is where you add nodes and build your node tree. When you add a node to the panel, its properties panel appears in the Properties Bin on the right. This is where you can adjust the node to produce the effect you’re after. To check the result, you can view the output in a Viewer.
You can open more panels using the content menus described in Toolbar, Menu Bar, and Content Menus. You can add several panels on the same pane and switch between them by using the tabbed pages on top of the pane.
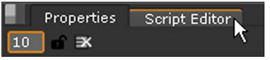
Panes are divided into tabbed panels on the top of the pane.
To go to a different tab, simply click on the tab name or cycle through available tabs using Ctrl/Cmd+T.